

Nonprofits live by metrics. Whether tracking grant deliverables, fundraising goals, or program impact, Key Performance Indicators (KPIs) define organizational performance and drive decision-making. Unlike for-profits focused purely on revenue, nonprofits measure success across three dimensions: fundraising revenue, program engagement, and mission reach. This Growth Heroes “admin hour” article explores the KPIs that matter, how to track them in Salesforce, and common pitfalls to avoid when implementing them.
What Are KPIs?
A key performance indicator (KPI) is a metric that helps executives define performance and empower decision-making. For nonprofits, KPIs often serve dual purposes—internal strategy and grant compliance. Many grants require reporting on specific metrics, making accurate tracking essential for funding eligibility.
With that foundation in place, let’s start with the most visible category of nonprofit KPIs: fundraising.
Fundraising KPIs: Following the Money
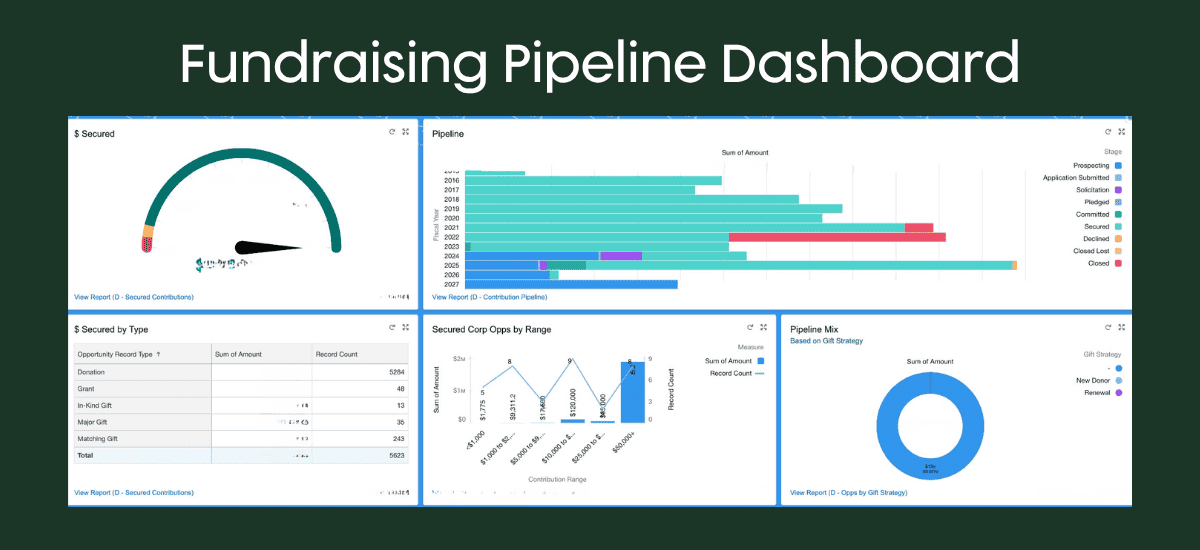
Revenue matters in nonprofits just like anywhere else. Most nonprofits track donations against budgeted goals while categorizing income by source.
Revenue by Category
Nonprofits typically organize donations into distinct buckets:
- Individual Donations: Regular personal gifts
- Corporate Donations: Company contributions
- Major Gifts: Often donors giving $1,000+ (exact threshold varies by organization)
- Grants: Foundation or government funding
- In-Kind Donations: Pro bono services, equipment, inventory (requires careful tracking for compliance)
- Stock and Crypto: Increasingly common but administratively complex
- Matching Gifts: Employer matches to employee contributions
How to track in Salesforce: Donations become opportunities, categorized by record type or type picklist. Roll up annually or by fiscal year.
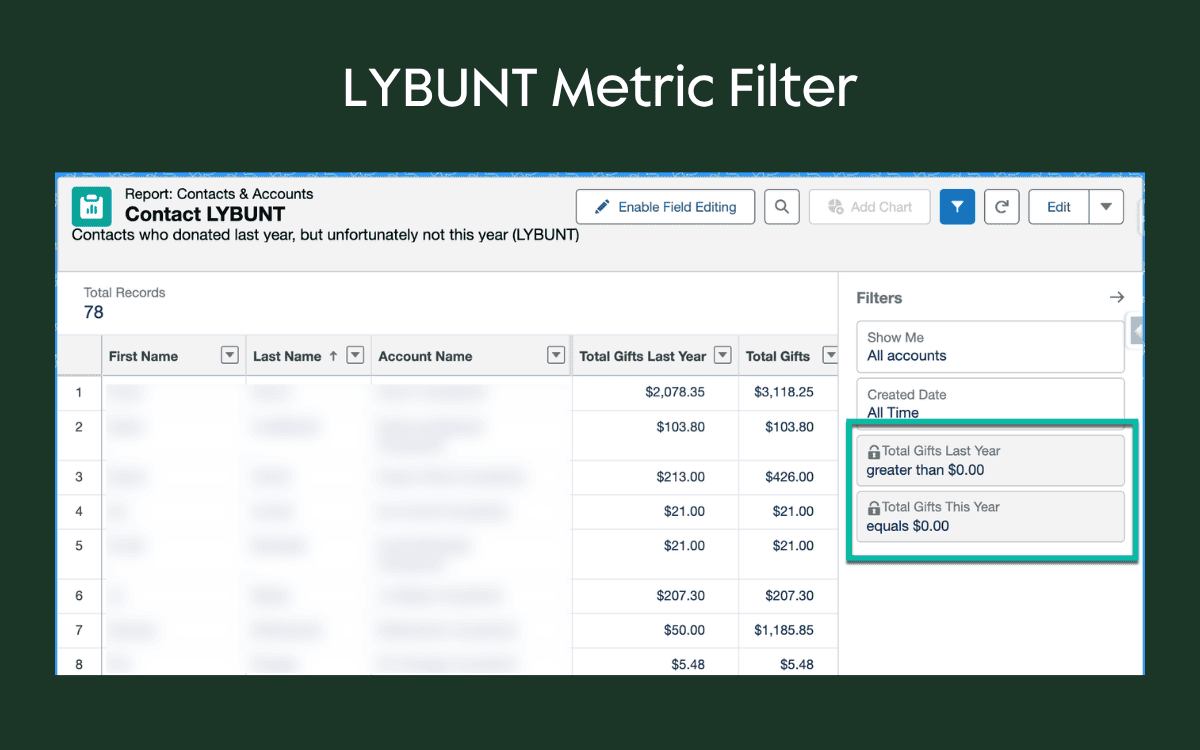
LYBUNT and Retention Metrics
Two critical nonprofit metrics often appear on dashboards:
- LYBUNT (Last Year But Unfortunately Not This Year)
- Retention
LYBUNT identifies donors who gave last year but haven’t given this year. However, the impact varies—five individual donors might matter less than losing one major donor who contributed $1 million.
Retention tracks both volume (how many donors did we keep?) and value (what was the financial impact of the loss?).
How to track in Salesforce: Create a simple report filtering for donations > $0 last year AND total donations = $0 this year. The same logic works for SYBUNT (Some Year But Unfortunately Not This Year)—donors who gave years ago but have since stopped.
Donor Scoring
The Nonprofit Success Pack includes out-of-the-box rollup fields that calculate donor strength automatically. These rollups track:
- Total gifts (dollars and count) by year
- Lifetime total gifts and count
- First gift, last gift, and best gift year
- Average gift amount
- Configurable lookback period (e.g., 3 years vs. 5 years ago)
These metrics appear on every contact record and update automatically as donations are logged.
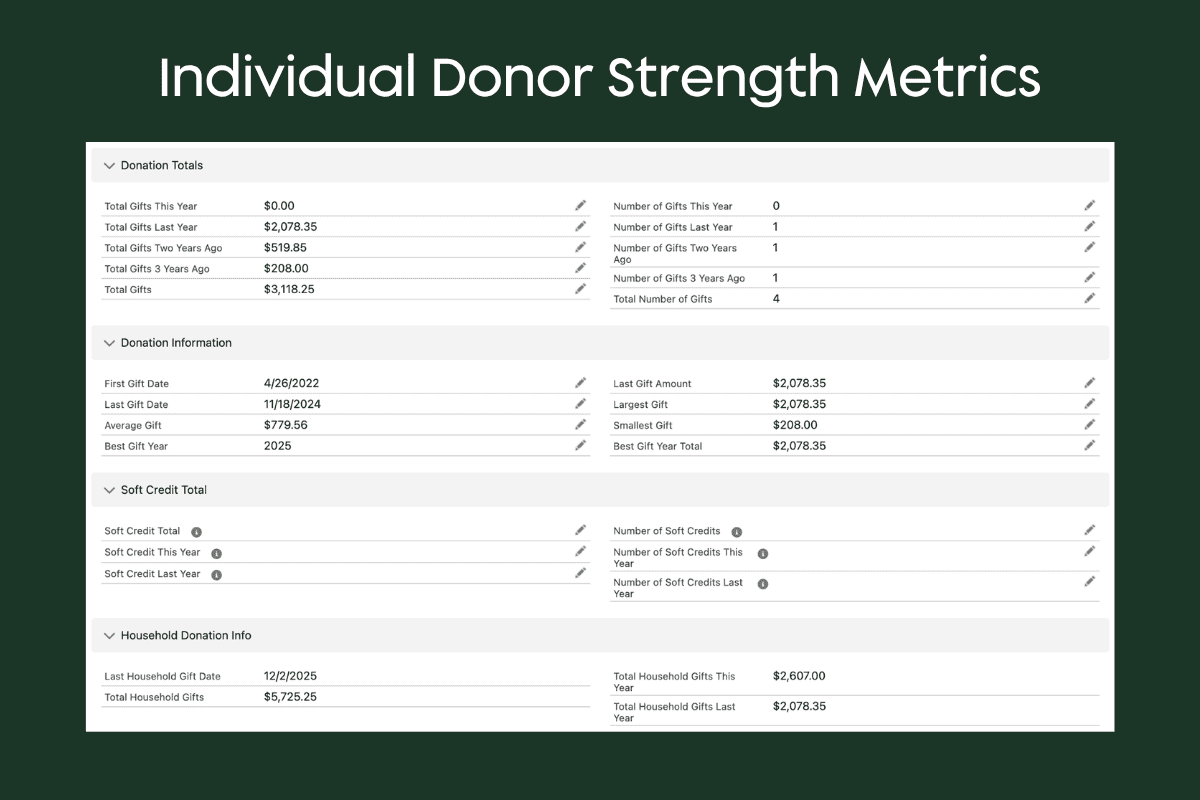
Soft Credits and Household Giving
Soft credits attribute giving credit to people who influenced a donation—An employer gave $100 because an employee gave $100, so the employee receives a soft credit. These influence relationships require manual tracking via opportunity contact roles but reveal who’s driving engagement.
Household giving tracks contributions across families. If a spouse donates and the husband donates separately, household totals show combined impact.
While fundraising metrics are critical, they only tell part of the story. Nonprofits also need to measure how their programs engage and impact the communities they serve.
Program Management KPIs: Measuring Engagement and Impact
Beyond fundraising, nonprofits measure how well their programs engage participants and stakeholders.
Engagement Scores
Engagement scores rate how actively partners, volunteers, or organizations participate in programs. These numerical scores typically combine:
- Program participation (attending meetings, events, volunteer hours)
- Organizational depth (bringing more people from your organization into the program)
- Financial contribution
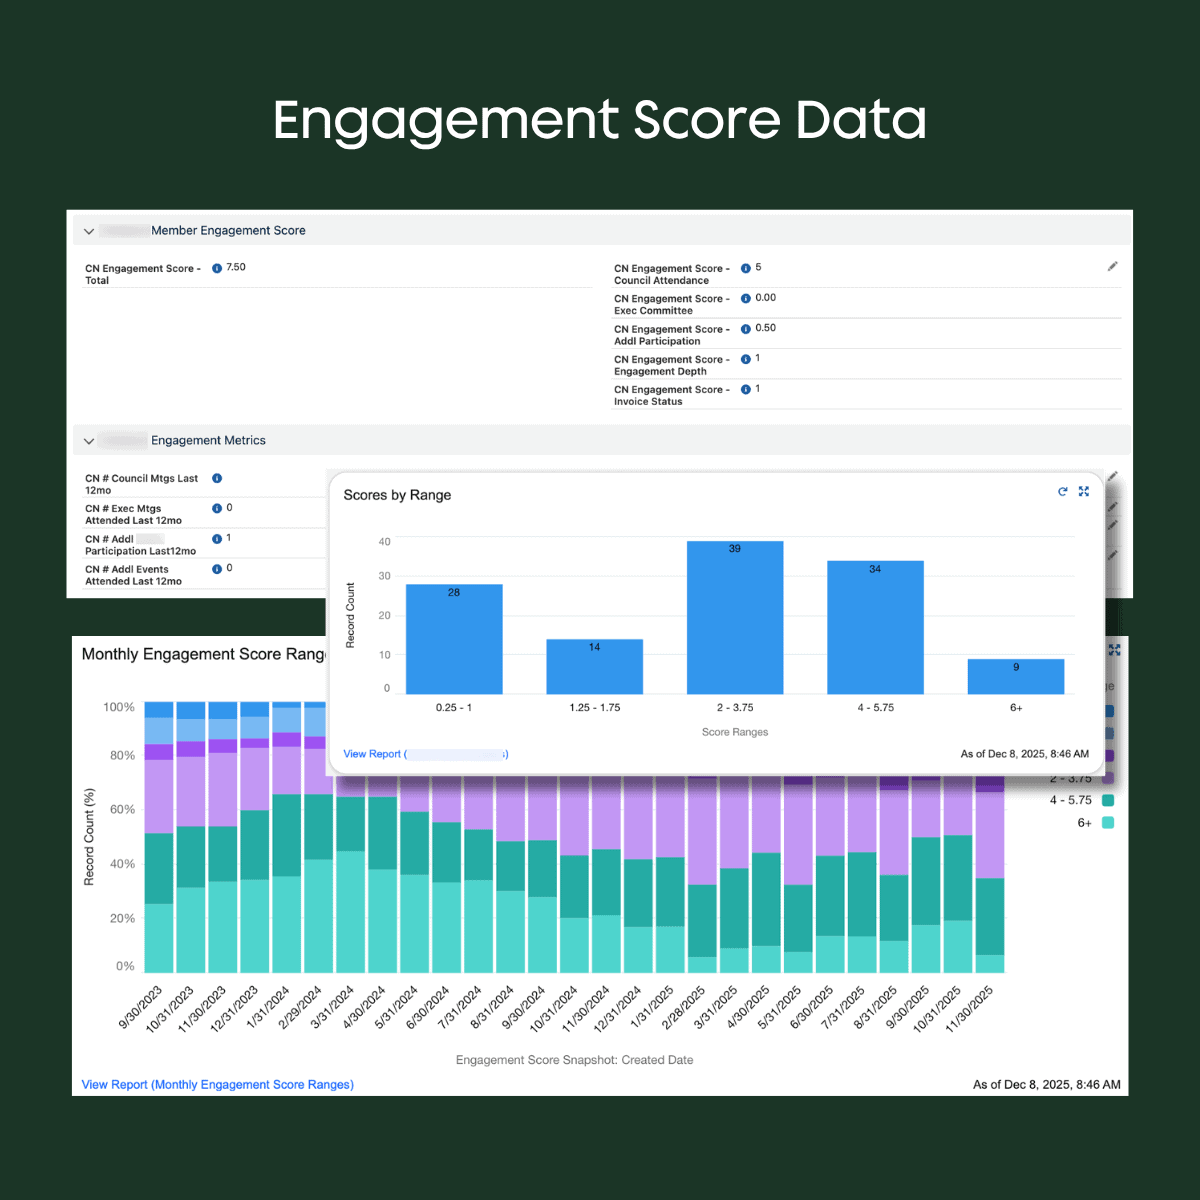
Example rubric: One nonprofit awards points for board meeting attendance (1 point each), executive committee meetings (0.25 points), program events (0.5 points), and membership dues (1 free point if paid). Maximum score: 10. If a board member brings a colleague from their organization, that’s “depth”—bonus engagement.
| Category | Methodology | Max Points |
|---|---|---|
| Board Meeting Attendance | 1 point per meeting attended (4 meetings annually) | 4 |
| Executive Committee Meeting Attendance | .25 points per meeting attended (4 meetings annually) | 1 |
| Additional Attendance and Participation | 5 points per program attended (examples: working groups, site visits, research participation) | 3 |
| Depth of Engagement | 1 point if any number of non-Council partner representatives participate in programming | 1 |
| Membership Dues Status | 1 point unless current invoice is more than 90 days overdue | 1 |
Different organizations assign weights to these categories differently. Some use color scales; others use numeric ranges. The key is consistent, documented rules.
| Score | Engagement Level | Description |
|---|---|---|
| 10 | High - Green | Donates $10K+ per year AND 5+ employees volunteer annually. |
| 9 | High - Green | Donates $10K+ per year AND 2-4 employees volunteer annually. |
| 8 | Moderate - Yellow | Donates $10K+ per year OR has 5+ employee volunteers per year. |
| 7 | Moderate - Yellow | Donates < $10K per year AND has volunteer representation (at least 1 employee). |
| 6 | Moderate - Yellow | Donates < $10K per year AND sponsors or hosts an event. |
| 5 | Low - Yellow | No financial donation but has 2-4 employees who volunteer annually. |
| 4 | Low - Red | Donates < $10K per year but no employee volunteering. |
| 3 | Low - Red | No financial donation and only 1 employee volunteers annually. |
| 2 | Low - Red | No financial donation and no volunteers per year. |
| 1 | Disengaged - Black | Confirmed no longer aligned with mission / interested in supporting; check in every 2 years. |
How to track in Salesforce: Use rollups and formulas to translate participation data (from campaigns, events, and custom objects) into scores. Complex hierarchies may require flows.
Program Dosage
Program dosage measures how many people you serve and how often. A literacy nonprofit might track books distributed. A therapeutic riding nonprofit tracks sessions held and participants served.
This metric often links to grant requirements—”We’ll deliver services to X people and measure success by participation.”
How to track in Salesforce: Ideally, programs use forms (e.g., Formstack, FormAssembly) where staff or volunteers self-report participation after each session. These sync to Salesforce as structured data, which rollups then aggregate by person and program. Manual entry is the backup—someone logs activities in Salesforce directly.
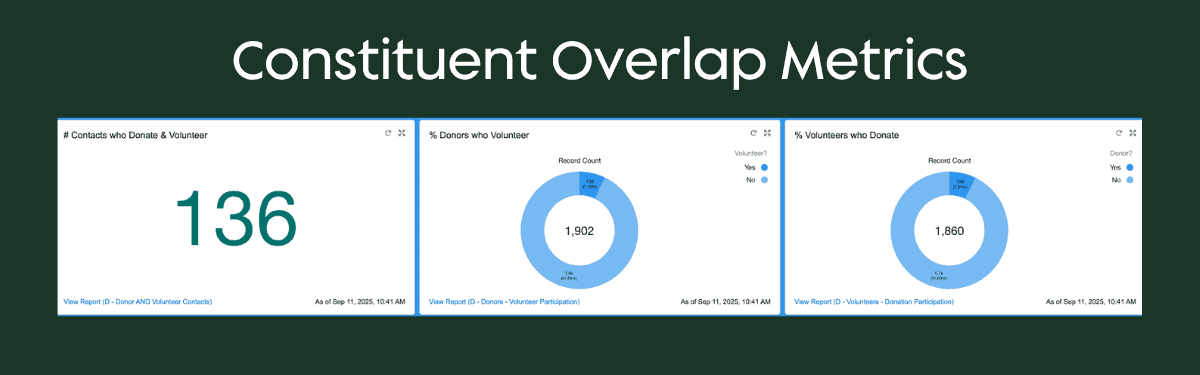
Constituent Overlap
Nonprofits often track how many people fulfill multiple roles—donors who volunteer, volunteers who donate, partners who give. This reveals conversion opportunities: Can we convert all volunteers into donors? What percentage of donors volunteer?
Overlap metrics typically answer: What percentage of our donors also volunteer? What percentage of volunteers also donate? Many nonprofits set targets to increase these percentages.
How to track in Salesforce: Once volunteer hours and donations sync to Salesforce, simple reports count records where both metrics are > 0, then calculate percentages.
In addition to measuring stakeholder engagement, nonprofits also need to understand how their mission is perceived and amplified externally.
Marketing KPIs: Visibility and Reach
Media Mentions and Speaking Engagements
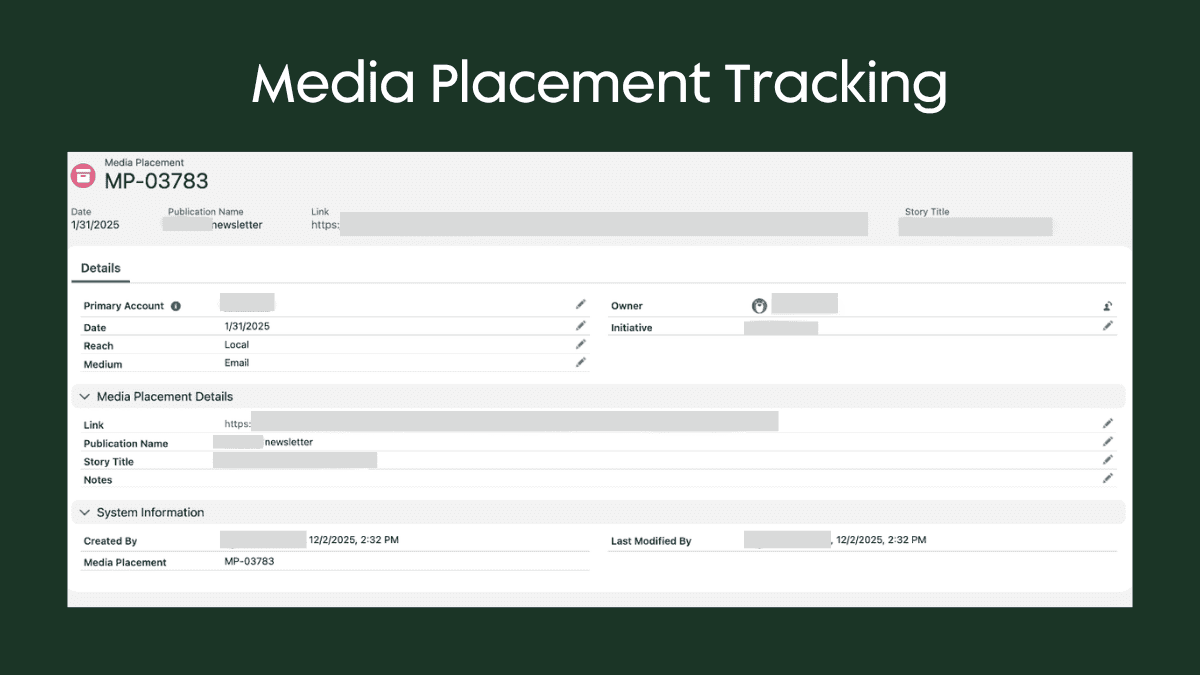
Nonprofits track how often they appear in news, blogs, podcasts, and social media. A custom object logs each mention with:
- Date
- Type (web article, podcast, social media post)
- Reach (local, regional, national)
Speaking engagements track invitations to present at events—another visibility metric.
How to track: Often manual logging, though tools like Meltwater automate mention detection. These are typically rolled up by month or year on dashboards.
Marketing Engagement
Email open rates, newsletter subscriber counts, and social media followers matter. Most nonprofits integrate email platforms (e.g., MailChimp, Account Engagement) with Salesforce, but social metrics remain largely external.
When external metrics can’t integrate, many nonprofits build a simple goal-tracking object to manually log targets and actuals over time.
Tracking these KPIs effectively requires more than definitions—it depends on how your data is structured and maintained in Salesforce.
Implementation Best Practices
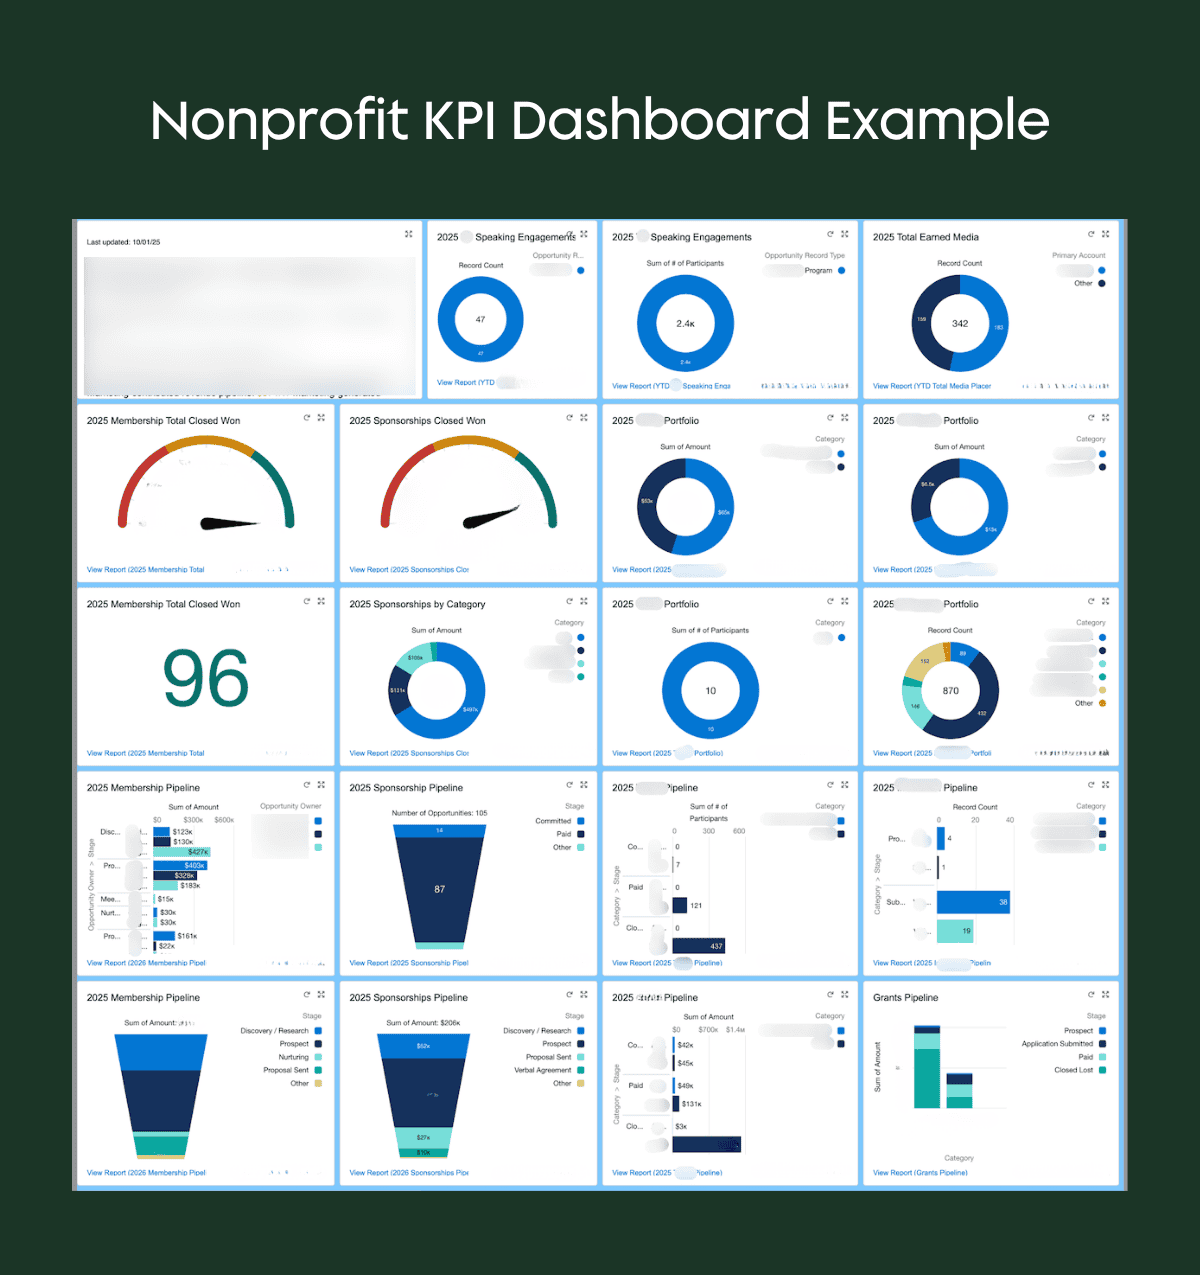
Map KPIs Before Building
Create a dashboard layout—even with blank spots—showing the KPIs you want to measure. This vision guides the work backward: “To measure this KPI, what data do we need? What will that dashboard widget look like?”
Ensure Data Is Collected
KPIs only work if you have processes to collect underlying data. Verify:
- Donations sync from payment platforms
- Programs use forms for self-reporting
- Data integrity dashboards flag missing or miscategorized records
Understand Calendar vs. Fiscal Year
Nonprofits often work on fiscal years (e.g., September–August), but donors think in calendar years. Nonprofit Success Pack rollups allow you to configure which, but messaging matters. If a donor gave in March, don’t tell them they haven’t given “this year” if your fiscal year started in January.
Count People or Organizations?
Define upfront: If two people from the same company attend an event, is that one engagement or two? Some nonprofits care about organizational reach; others care about individuals touched. The answer changes how you build rollups and reports.
Use Fiscal Year Settings
In Salesforce setup, configure your organization’s fiscal year. Rollups rely on this setting to correctly calculate “this year” vs. “last year.”
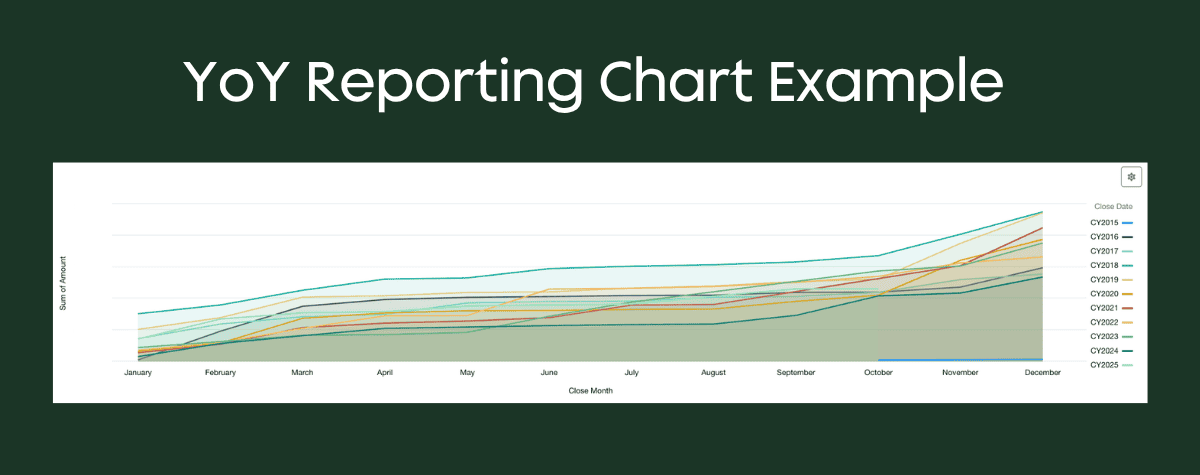
Year-Over-Year Reporting
To compare metrics across years on one report:
- Create two date fields on the report (e.g., close date and close date 2)
- Group one by year, the other by calendar month/year
- Plot both on the same chart
- Enable “cumulative” to see trends over time
This technique works for fundraising, engagement, or any time-series metric.
Snapshot Reports for Tracking Change Over Time
Salesforce records are point-in-time—engagement scores update hourly, making historical trends invisible. Snapshot reports solve this: Define a report, schedule it (daily, weekly, monthly), and Salesforce keeps timestamped copies.
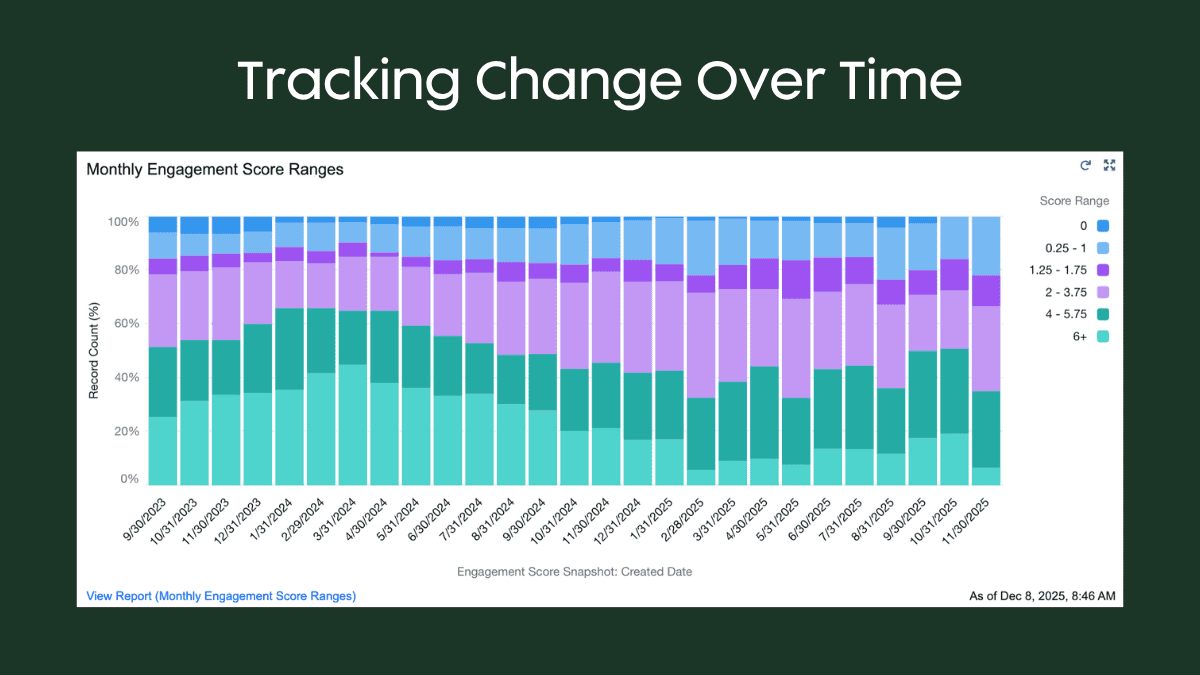
Use snapshots to: Track donor score changes month-over-month, monitor payment status changes quarterly, or measure constituent overlap growth annually.
Schedule options: Daily, weekly, monthly. Set up email summaries to monitor success/failure.
Limitations:
- 2,000 row maximum per snapshot (depends on how you summarize)
- Changing fields breaks historical data (new fields won’t have historical values)
- Can’t schedule infinitely; set reminders to revisit
- Tip: Use formula fields so you can change logic without breaking snapshots
Filtering KPI Dashboards
Dashboards based on rollup fields are difficult to filter—you can’t slice rollup values by territory on the fly. Workaround: Use raw opportunity reports for dashboard widgets instead of rollups when filtering is needed.
Even with strong implementation practices, a few common questions tend to come up as teams refine their approach.
FAQ
Can I use Nonprofit Success Pack in a for-profit Salesforce org?
Nonprofit Success Pack only works in nonprofit Salesforce orgs. If your nonprofit works primarily with organizations (not individuals), you may need a standard Salesforce org for flexibility, though you’ll lose some packaged features.
What if my nonprofit works on a fiscal year, but donors think in terms of a calendar year?
Both work—but clarify in communications. Nonprofit Success Pack lets you configure fiscal vs. calendar year for rollups. Just ensure messaging matches donor expectations.
How do I track KPIs that change over time (like engagement scores)?
Use snapshot reports. They capture point-in-time data on a schedule, letting you see historical trends. They can be filtered as well by things like territory or region. The raw fields you choose determine your filtering flexibility. They are limited to 2,000 rows per run though.
Should I use payment platform integrations or log donations manually?
Integrate if possible. Manual entry introduces errors and delays. Most payment platforms (e.g., Donorbox, Blackbaud, etc.) offer Salesforce integrations. You can also use a Salesforce native payment solution.
Conclusion
- fundraising revenue
- program impact
- mission visibility
Salesforce provides native tools—Nonprofit Success Pack rollups, snapshot reports, custom objects—to track them. Start by mapping your ideal dashboard, then work backward to identify data sources and collection processes. Use year-over-year reporting and snapshots for trend analysis. Most importantly, ensure data flows accurately; garbage in, garbage out applies even to missions-driven organizations.
Turn Your Nonprofit KPIs into Actionable Insights
Well-defined KPIs are only as valuable as the systems and processes behind them. When your data model, integrations, and reporting are aligned, Salesforce becomes more than a system of record—it becomes a tool for understanding impact and driving smarter decisions.
If your team is struggling to track engagement, report on outcomes, or trust your data, it may be time to revisit how your KPIs are structured and measured.
Explore how we help nonprofits design and optimize Salesforce solutions that support fundraising, program management, and mission growth.